Revenue Reports
Find out where you can easily monitor your event ROI, voucher usage, and event transactions

Mark
Last Update 4 年前
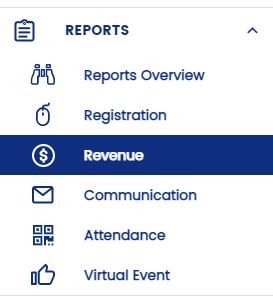
Monitoring your event's revenue is essential for determining its success. To access your Revenue Reports, make sure you are in the correct Event Workspace before clicking 'Event Reports' > 'Revenue' in the Event Menu.
Here, you'll see that the page has 3 tabs:
Key Statistics
This tab shows you an overview of your revenue reports and it presents the data in a way that you might find useful. You can see graphically which tickets have been performing the best and customise the graph that you're looking at with metrics that you would like to see.
Revenue Over Time
This graph shows your revenue over time for each ticket class that you have. You can select the time frame to study by toggling the 'Since Event Creation' dropdown menu beside the 'Export' button. You can also choose the ticket classes to include or exclude by checking or unchecking their respective boxes.
Gross Revenue
This simply tells you how much money you have raked in to date!
Gross Revenue By Ticket Class
This pie chart shows you the gross revenue across your ticket classes. Keep in mind that a higher revenue does not necessarily mean better performance as the revenue is directly proportional to the price of the tickets too. For a better gauge of ticket performance, head over to your Registration Reports instead.
Vouchers
If you have previously created vouchers for your event, you'll be able to monitor their usage under this tab. You are also able to export this report by clicking the 'Export' button.
Transactions
You can also monitor all monetary transactions for your event under this tab. From here, you will be able to keep track of who bought tickets, their contact details, and payment method.
From here, you can also issue refunds to your guests if needed. Find out how you can perform this action here.