Virtual Platform Reports
How to navigate the virtual event report module
Mark
Last Update 3 jaar geleden
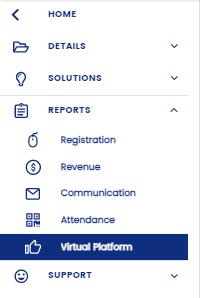
Within the correct event workspace, navigate to Reports > Virtual Platform to view all the data collected from your virtual event.

You will see three tabs along the top and here we will talk you through each one.
Key Statistics
Logins over time
Presented in graph form, you will firstly see the 'logins over time' which indicates the number of logins to your virtual event platform (you guessed it) over time. Hover over the graph to see details of each time stamp or press the "Export Logins" button in the top right hand corner to download the information into an xls doc.
Unique Logins
Highlights the total number of individuals that have logged in to your virtual event platform. Unlike 'logins over time', this statistic shows unique logins and therefore does not count the same individual multiple times (if they logged in on many different occassions).
Turnout
As an event planner, turnout is probably one of the most important pieces of post event data you can have, to show event success. Here you will be able to easily see the percentage turnout for your virtual event compared to number of registrations, highlighting the number of attendees and no shows.
App Activity
The App activity bar graphs show a number of interactions your guests have had on your virtual event platform such as comments, poll responses and session views. Hover over the bar of the activity you'd like to know more about and hit "DOWNLOAD" to retrieve a more detailed report.
Geography
Geography shows the location of your attendees. On the right hand side you will see a key, whilst hovering over each coloured bar will show you the country and number of attendees from said country.
Engagement App
Continuing from the 'App Activity' bar chart, the Engagement App section allows you to see a few more metrics based on the engagement that happened on your platform including messages sent, meeting booking, sessions which were bookmarked (to name a few). Hover over the section you want to explore further and hit DOWNLOAD to get the xls report.
Engagement/Streams
This tab allows you to individually look at the stats related to individual streams. Click on the room name to open up a detailed report from that stream. Here you will be able to see views, questions asked, poll and quiz responses and more.
Additionally scroll to the right hand side of the room name and you can export or download the data showing the length of time people viewed the stream or playback for. This is a great resource to see how "good" or "engaging" a session was!
Attendees
The attendees tab allows you to view and manage attendees who have registered for your virtual event. You can change their password, assign them as speaker or moderator, and copy the magic link to send them. You can also manage admins and speakers if needed. Take note that the magic link is unique per attendee.

